What is the Gender Pay Gap?
More Focused Comparison
Pay Gap Differs by Ethnic Group
Civil Service and Exempt Executives
Executive Summary
On January 27, 2022, Governor Gavin Newsom and First Partner Jennifer Siebel Newsom signed the “California Equal Pay Pledge,” an initiative the First Partner launched to close the gender pay gap. The pledge commits employers to conduct “an annual company-wide gender pay analysis, reviewing hiring and promotion processes and procedures to reduce unconscious bias and structural barriers, and promoting best practices that will close the pay gap to ensure fundamental equity for all workers.”
In an effort to meet this challenge, CalHR re-evaluated how it analyzes state employee compensation and demographic data for its annual Women’s Earnings in State Civil Service Report. Beyond reporting the statewide gender pay gap, CalHR explored factors contributing to the gender pay gap by analyzing the gender pay gap at the bargaining unit, occupation, and classification level. This approach allows the Administration to develop targeted strategies that could help close the statewide gender pay gap, as well as any bargaining unit, occupation, or classification level gender pay gap.
The research for this report has led us to two major conclusions:
- Over the past 10 years, the statewide gender pay gap has narrowed for California civil service employees
- The state’s compensation practices are more equitable when analyzing gender pay at the bargaining unit, occupation, and classification level
The State of California is Closing the Statewide Gender Pay Gap
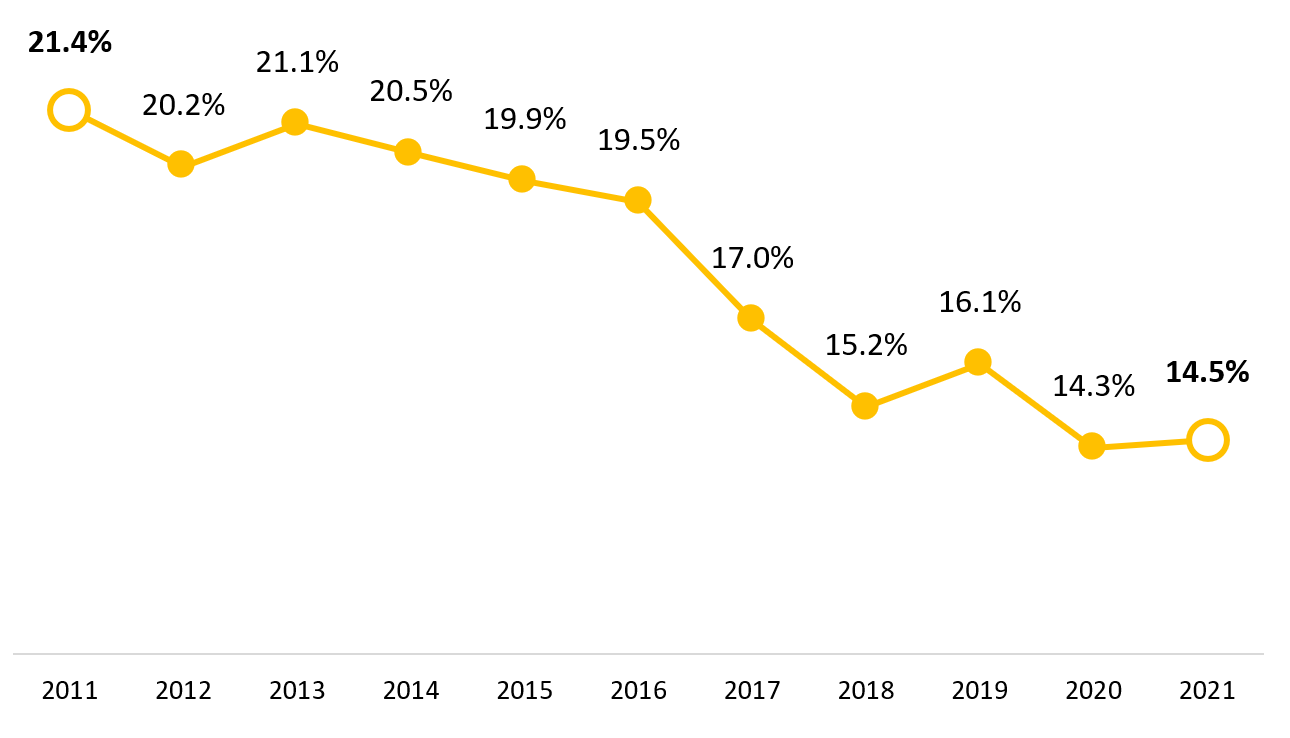
Since 2011, the statewide gender pay gap has trended downward. This is primarily due to a greater representation of women in higher paying state jobs (see Chart 16). This demographic shift has brought the median base pay for both genders closer together and helped reduce the gender pay gap over the past 10 years.
[1] In 2011, the gender pay gap was 21.4 percent, and as of 2021, it was 14.5 percent.
[2]
Chart 1: Statewide Gender Pay Gap in California State Civil Service Since 2011
Initiatives to Broaden and Diversify Applicants for State Jobs and Make the State Workplace More Inclusive
Since 2011, CalHR (previously the Department of Personnel Administration) has initiated a series of new policies, programs, and resources to help diversify the applicant pool for state jobs and promote a more inclusive workplace.
State Jobs Website Modernized
The state of California created its first jobs website in 2012. In 2016, CalHR significantly redesigned the jobs website (CalCareers.ca.gov), which made it easier for job-seekers to find and apply for state jobs online.
State Civil Service Exams Offered Online
In 2011, 93 civil service examinations were available online. As of 2021, the state’s jobs website had 481 online civil service examinations.
State Jobs Advertised Online
Since 2017, departments have been required to advertise all civil service vacancies a minimum of 10 business days on the state’s jobs website[3] – in an effort to increase the applicant pool and make applying for state jobs more equitable. In 2021, more than 41,000 job postings were advertised on the state’s jobs website.
Hiring Best Practices & Implicit Bias Training
In 2016, CalHR re-designed its Best Hiring Practices curriculum for state human resources professionals to include guidance for using unbiased interviewing and screening criteria for state jobs. In 2020, CalHR started providing implicit bias training to promote a more diverse and equitable workplace and has since added several more courses focusing on the broader topic of diversity, equity, and inclusion. More than 1,500 state employees have attended these courses collectively.
Statewide Leadership Training for State Supervisors, Managers, and Executives
Since 2017, CalHR has delivered mandatory training to nearly 7,000 new-to-role supervisors, managers, and executives through the California Leadership Academy training program. The purpose of the California Leadership Academy is to provide supervisors, managers, and executives with the tools they need to lead and empower their teams through performance development and process improvement. Diversity, equity, inclusion, and implicit bias topics are interwoven throughout each course.
New Discrimination Complaint Tracking and Monitoring Unit
In 2020, CalHR implemented a new Discrimination Complaint Tracking and Monitoring Unit to maintain statewide oversight of the collection and analysis of Equal Employment Opportunity (EEO) complaint data across all state departments. The first annual report was published in early 2022. As additional data is collected, trends and patterns are being identified that will lead to improvements in how discrimination and harassment complaints are addressed.
Statewide Non-traditional Apprenticeship Program
In 2017, the Government Operations Agency (GovOps) partnered with the Division of Apprenticeship Standards at the Department of Industrial Relations, and Service Employees International Union Local 1000, to pilot a non-traditional apprenticeship program in occupational sectors outside the building trades as a career development and succession management strategy. Since its inception, 105 state employees have graduated from this program, and the pilot has grown to include three Information Technology and one Financial Services programs. It was transferred to CalHR in 2021 for further development and expansion to a true statewide program.
Workforce and Succession Plan Requirement Policy
In 2017, CalHR released the Workforce and Succession Plan Requirement Policy to require all state organizations with civil service employees to maintain current workforce and succession plans, and report to CalHR annually on the status of those plans. This proactive and strategic approach to recruit, develop and retain a skilled and diverse workforce ensures organizations can deliver on their critical missions now and in the future. The policy includes guidelines and references tools and resources that assist departments in identifying their workforce’s demographic makeup, competencies, and classification risks with the intent of developing and implementing appropriate mitigation strategies.
While it is difficult to quantify the effects of these initiatives, CalHR believes they have helped the state broaden its pool of candidates for state jobs and promoted a more diverse and inclusive workplace.
California Leads as an Employer
In the Fall of 2019, Governor Newsom convened Executive Branch leaders to discuss how to create a more inclusive, respectful, and equitable state workplace that reflects the values of a California for All. Attendees of this forum volunteered to participate in four task forces—Sexual Harassment and Discrimination Prevention and Response, Diversity and Inclusion, Public Safety Diversity, and Racial and Gender Pay Equity. CalHR secured funding in the Governor’s 2022-23 Budget to begin implementation of the task force recommendations. See
New Initiatives to Address the Gender Pay Gap at the end of this report for more details on CalHR’s new initiatives that could help close the gender pay gap.
On September 13, 2022, Governor Newsom signed
Executive Order N-16-22 that requires, among other things, departments to embed explicit analysis of equity considerations in policies and practices and to take concrete steps to address existing disparities in opportunities and outcomes. The Executive Order furthers the Administration’s commitment to a California for All that supports every Californian’s opportunity to achieve a better life, regardless of where they start out.
In 2022 Governor Newsom also signed bills focused on advancing pay equity through CalHR action:
AB 316 of 2022 by Assemblymember Jim Cooper (D-Elk Grove) requires departments to establish a plan to address underutilization of specific groups as documented by their workforce analysis and adds additional reporting requirements related to pay equity.
AB 1604 of 2022 by Assemblymember Chris Holden (D-Pasadena) will provide state employees with greater opportunity to move upward within state service through improvements and best practices in processes for hiring, recruiting, and retaining a diverse workforce.
Purpose of the Report
CalHR prepared this report for the Legislature in accordance with Government Code section 19827.2 prior to its amendment in September 2022. Future reports will provide additional data and analysis to comply with the statutory amendments of Assembly Bill 316 (Cooper).
This report is based on data from December 2021 and includes contextual data dating back to 2011.
[4]
Authority to compile this report derives from Title 2, Division 5, Part 2[5]of the California Government Code, and does not include information for those exempted from civil service status under Article VII, Section 4 of the California State Constitution, except where exempt executive pay is discussed.
What is the Gender Pay Gap?
The “gender pay gap” is an equality measure comparing the median earnings of women and men. Once a year the state compares the median base pay of male civil service employees with the median base pay of female civil service employees.[6] This “dollar” difference is converted to a percentage. A pay gap of 20 percent would mean that females earn 80 percent of the male median base salary. It is important to note, base pay does not include pay differentials, extended duty week compensation, or overtime pay.
How is the Gender Pay Gap Calculated?
There are two steps for calculating the gender pay gap:
- Determine the median monthly pay for each gender
- Calculate the percentage difference in median pay
Calculating the Gender Pay Gap: Determine the Median Base Pay by Gender
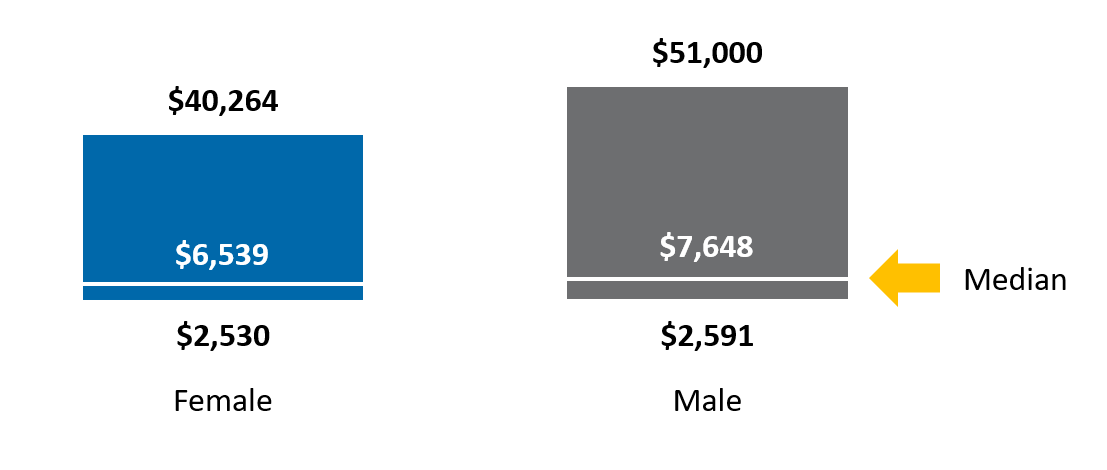
To find the median pay by gender, the base pay for all full-time civil service female and male workers is separately arranged from high to low. The median is then identified – meaning half of the salaries are above and half are below. Monthly base pay for females and males is displayed in the chart below. Female monthly base pay is represented by the blue bar on the left, and male monthly base pay is represented by the grey bar on the right. The white line represents where the median base pay is located in each bar. As of 2021, the median monthly pay for women was $6,539, and $7,648 for men.
Chart 2: Maximum, Median, and Minimum Monthly Base Pay in 2021[7]
Calculating the Gender Pay Gap: Calculate the Percentage Difference in Pay
Next, the median base pay for women is divided by the median base pay for men. This produces a ratio, which in this case, is 85.5 percent.
$6,539 / $7,648 = 85.5%
This ratio is often expressed in terms of dollars and cents when discussing the gender pay gap. For example, this could be expressed as women earn 86 cents compared to each dollar earned by men. To turn this ratio into a pay gap, the 85.5 percent is subtracted from 100 percent, which produces a gender pay gap of 14.5 percent.
100% - 85.5% = 14.5%
Accordingly, 14.5 percent is the California state civil service gender pay gap for 2021.
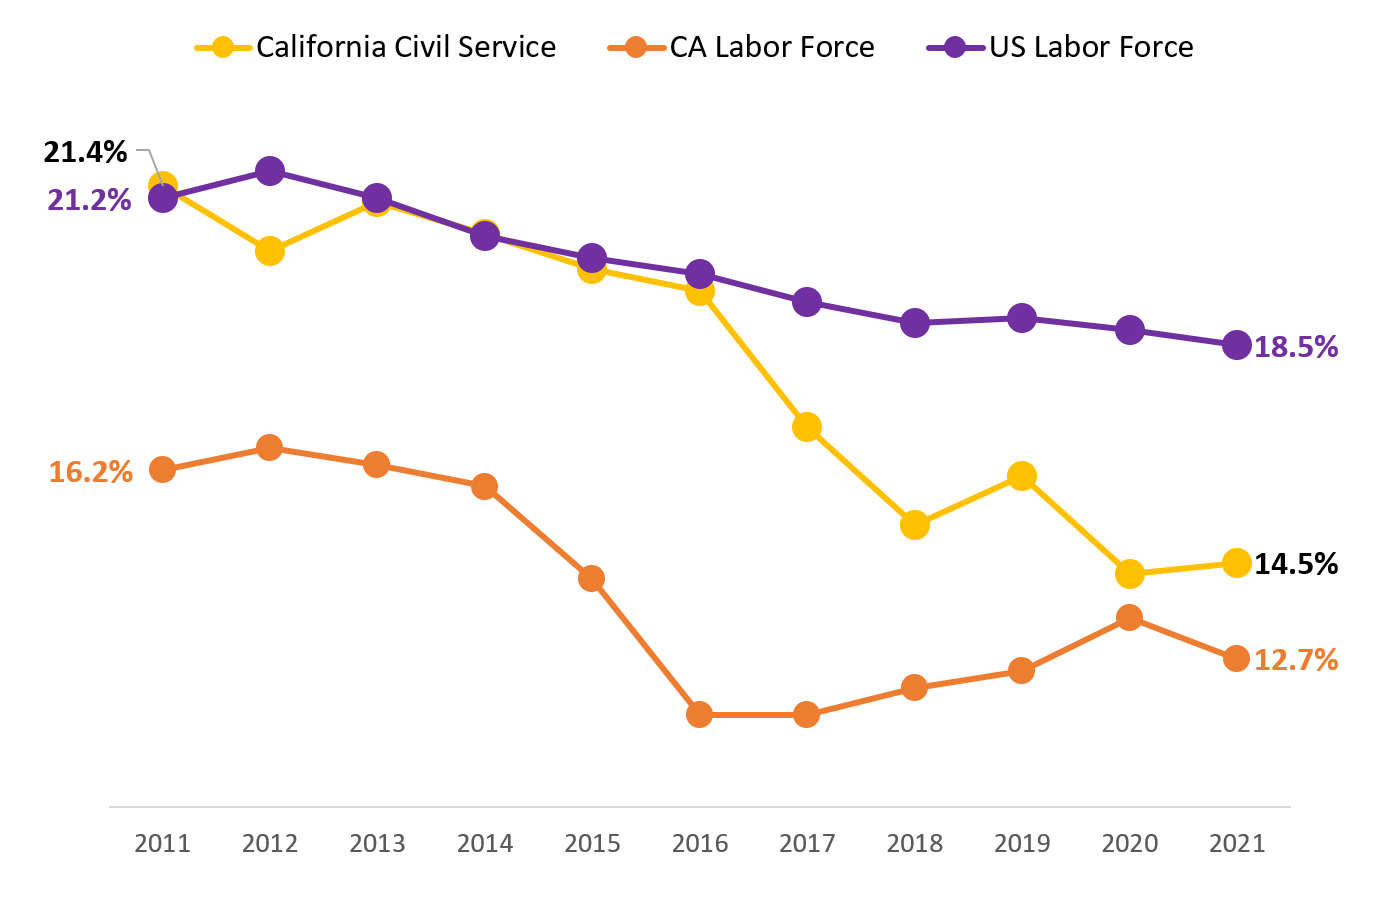
The Gender Pay Gap for California’s Civil Service Closed Faster than in U.S. Labor Market
Since 2011, the state has made more progress in closing the gender pay gap (from 21.4 percent to 14.5 percent) than the U.S. labor market. For several years, the gender pay gap in California’s Civil Service has been lower than the national gender pay gap. The labor market data for median pay by gender originates from the U.S. Census Bureau’s American Community Survey estimates for 2011 through 2021.
[8]
Chart 3: Comparing the Gender Pay Gap in California’s Civil Service with California and U.S. Labor Markets Between 2011 and 2021
 Women Are Better Represented in California Civil Service Jobs than in the California or U.S. Labor Markets
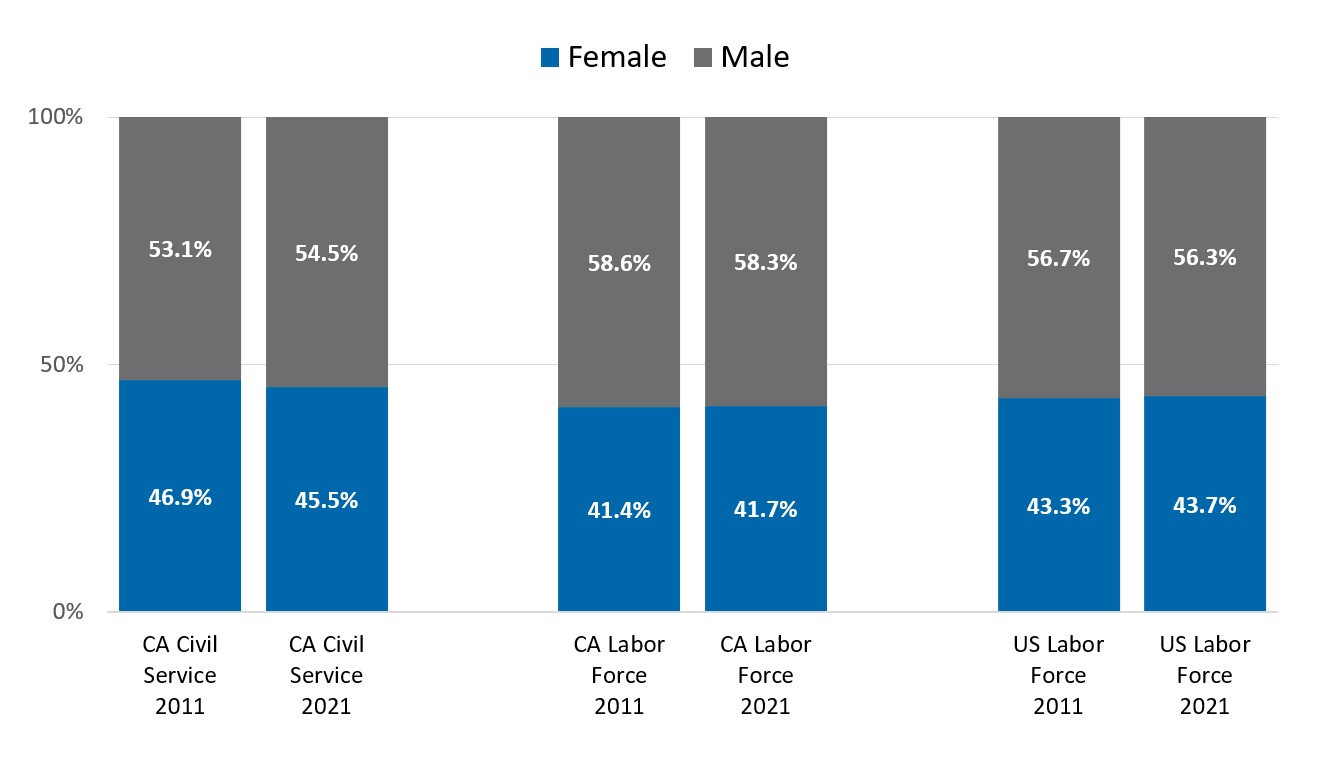
California’s state civil service employs a larger share of female workers than the California or U.S. labor market. However, between 2011 and 2021, the share of women employed in the state’s civil service has declined by 0.6 percent, while the share of women in the California and U.S. Labor Markets increased between 0.3 and 0.4 percent during the same period.
[9]
Chart 4: Comparing Full-Time Employment in California State Civil Service with California and U.S. Labor Markets in 2011 and 2021
More Focused Comparison Shows Fewer Employees Affected by a Gender Pay Gap
The 14.5 percent statewide gender pay gap is derived by comparing salaries paid to all full-time state civil service workers in 2021, regardless of occupation or job. But median pay and pay gaps can be compared in more refined ways, providing more context for understanding the gender pay gap in California’s civil service.
This report also calculates a gender pay gap for rank-and-file employees in the state’s 21 bargaining units, 292 detailed occupations, and 1,318 state civil service classifications.
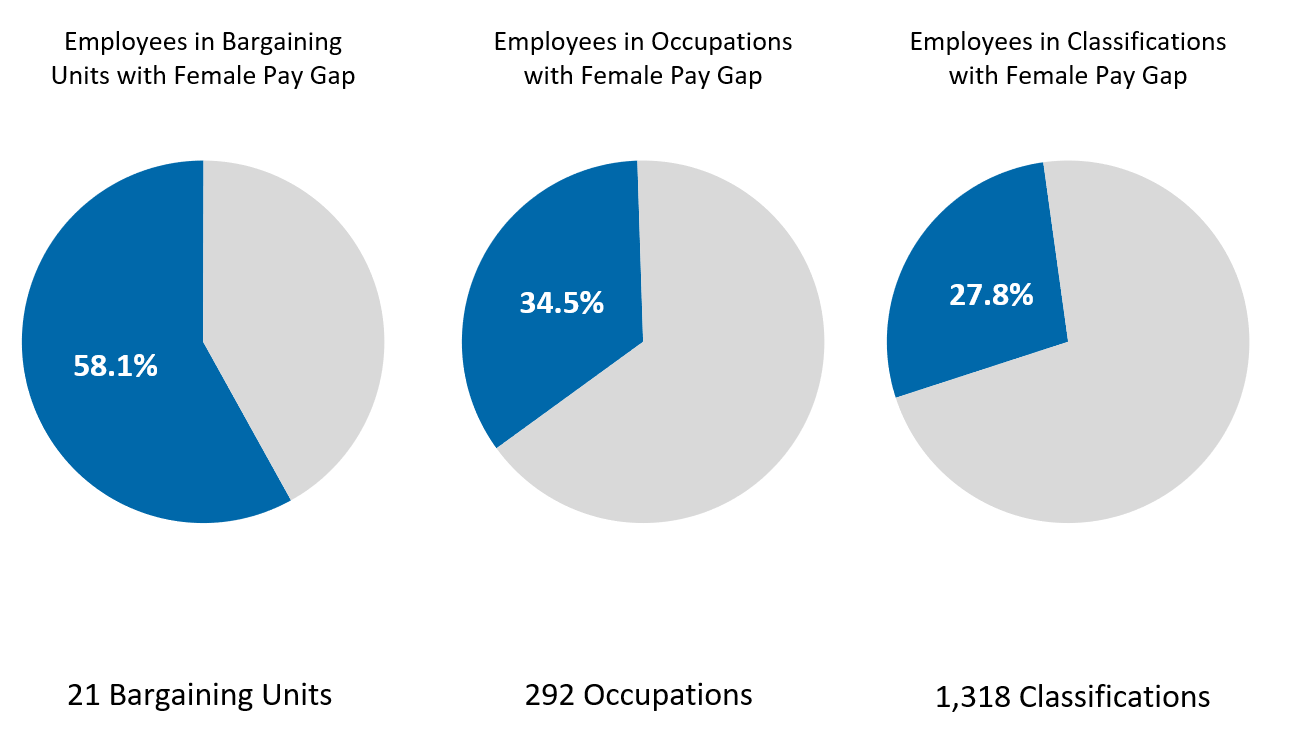
As illustrated in the chart below, the percentage of rank-and-file employees affected by a female pay gap is reduced dramatically when compared within their respective bargaining unit, occupation, or classification.
Chart 5: Percentage of Rank-and-File Employees in Bargaining Units, Occupations, and Classifications with a Female Pay Gap
 Comparing the Gender Pay Gap by Bargaining Unit
Since 1982, most of California’s civil service employees have been grouped into different bargaining units, each representing different professions and occupations. It is possible to compare the median pay for females and males within each bargaining unit to see if there is a gender pay gap.
Overall, about 58 percent of represented state employees were in a bargaining unit where there was a female gender pay gap in 2021.[10]
Chart 6: Percentage of Employees in Bargaining Units with Gender Pay Gap in 2021

The chart below illustrates that in 2021, there was a female pay gap in 11 bargaining units, no pay gap in seven units, and a male pay gap (because the median pay for men was lower than median pay for women) in three units.[10]
Chart 7: Gender Pay Gap by Bargaining Unit in 2021

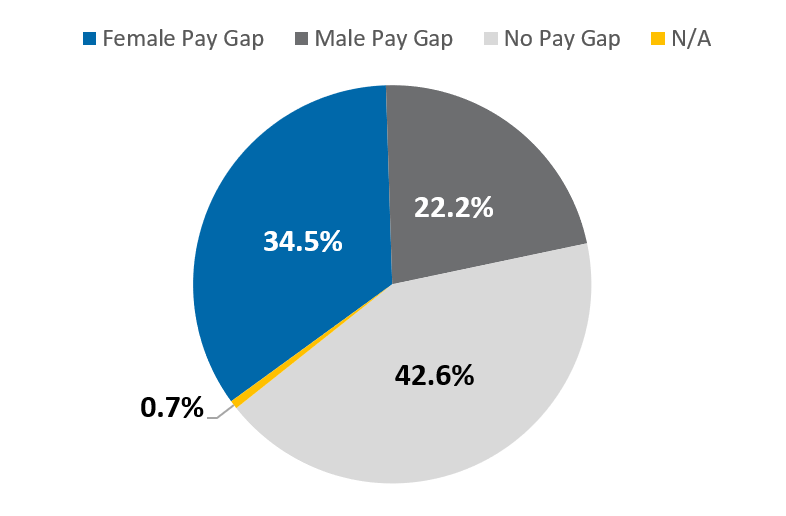
Comparing the Gender Pay Gap within Detailed Occupations
State classifications have been mapped to federally defined detailed occupations. Some bargaining units represent state employees associated with one occupation, while others represent employees working in dozens. For a more refined analysis, we now compare pay by gender for rank-and-file employees within nearly 300 detailed occupations.
A
s of 2021, about 35 percent of rank-and-file state employees were working in an occupation with a female pay gap.[10]
Chart 8: Percentage of Employees in Occupations with Gender Pay Gap in 2021
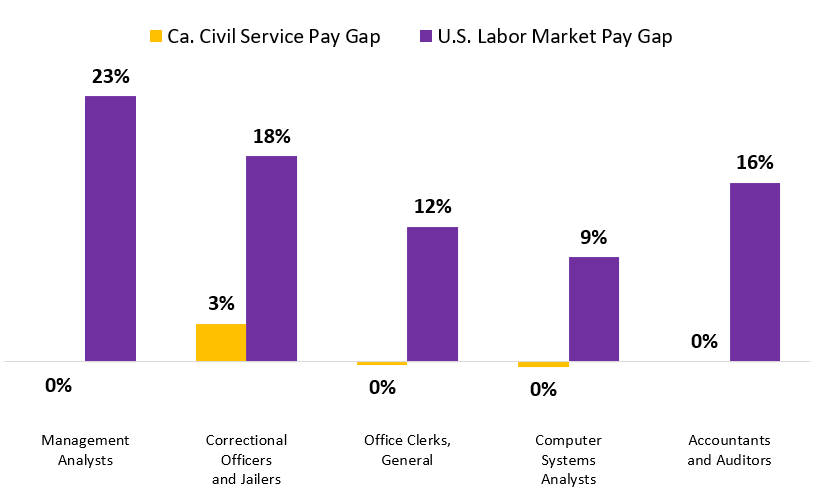
As a case study, we can look at the five occupations where the most state workers are employed.
[11] The chart below illustrates there is a large gender pay gap for women in these occupations in the U.S. Labor Market, while the median pay for rank-and-file female and male state employees is very similar.
[12]
[13]
Chart 9: Comparing Gender Pay Gap in California Civil Service with U.S. Labor Market
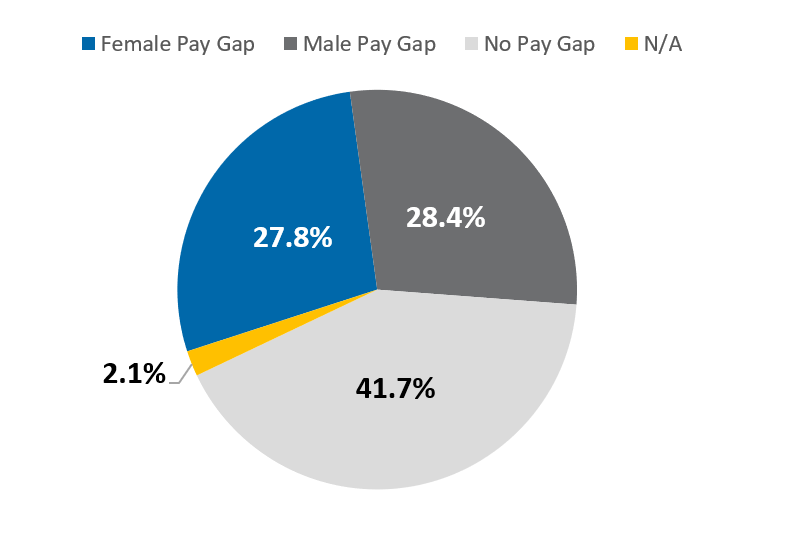
Comparing the Gender Pay Gap within Classifications
The most refined analysis comes from comparing how males and females are paid within state classifications. As shown below, fewer than one third of state classifications show a female pay gap. The classification system reduces the risk of pay gaps because state civil service employees are paid within a prescribed pay range for each classification. Most employees do not negotiate a starting salary, a practice that is much more common in the private sector. Employees typically start at the minimum salary and progress over time to the maximum salary of the range. For many state classifications that can take up to five years. Any gender pay gaps within state classifications are primarily driven by a larger share of men or women at one end of the pay range.
The chart below illustrates two major takeaways when analyzing the gender pay gap at the classification level
[14]:
- Nearly 42 percent of rank-and-file employees were in classifications with no gender pay gap
- The remaining rank-and-file employees were distributed fairly even between classifications with a female pay gap or a male pay gap
Chart 10: Percentage of Rank-and-File Employees in Classifications with Gender Pay Gap in 2021
Understanding What Drives the Gender Pay Gap
How state employees are paid within different bargaining units has a significant impact on the statewide gender pay gap. Eighty-two percent of full-time state civil service employees work in a classification represented by one of the 21 bargaining units. Salaries negotiated for each unit drives the statewide median pay for both genders. Chart 11 shows the bargaining units arranged by median base pay, from low to high. The statewide monthly median pay for female and male employees is inserted in between the monthly median base pay for each bargaining unit.
Chart 11: Monthly Median Base Pay by Gender and Bargaining Unit in 2021[15]
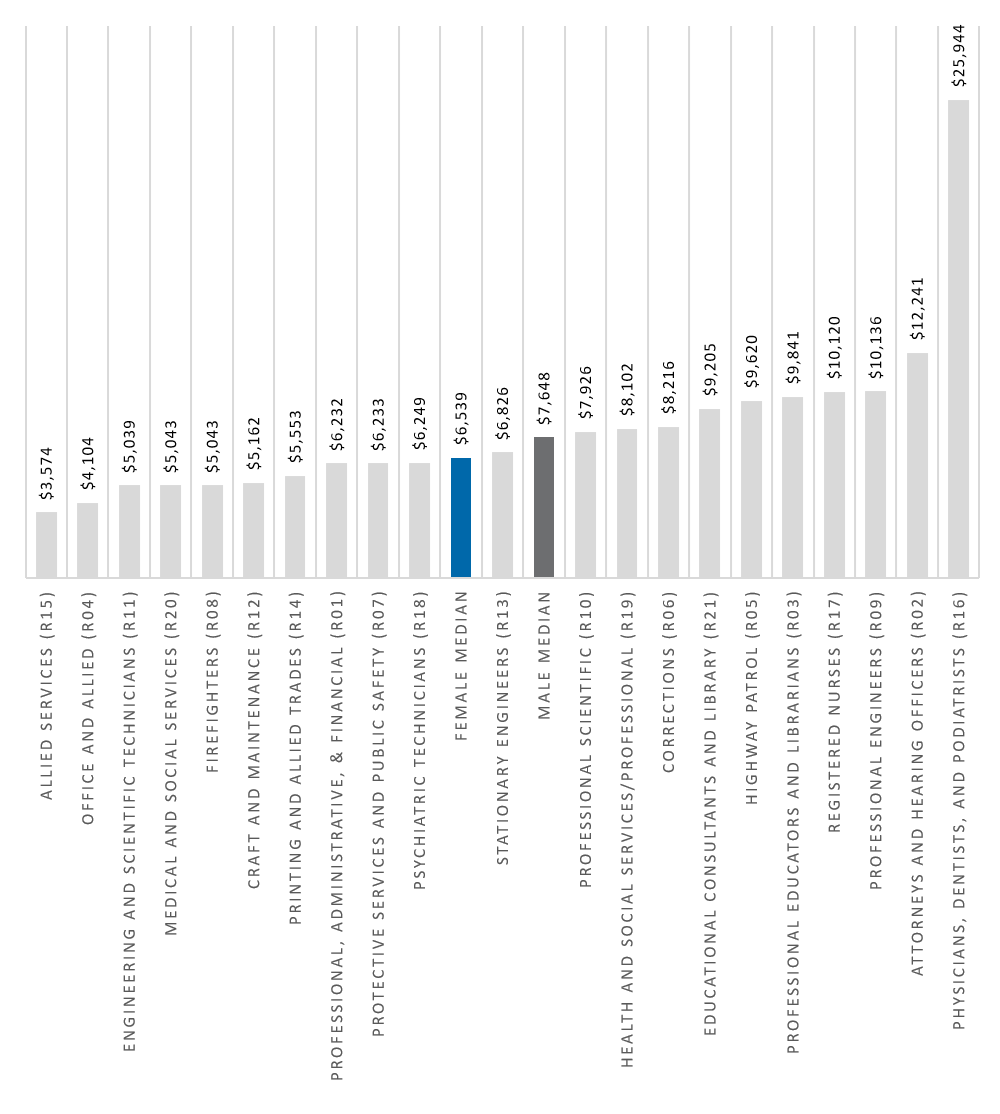
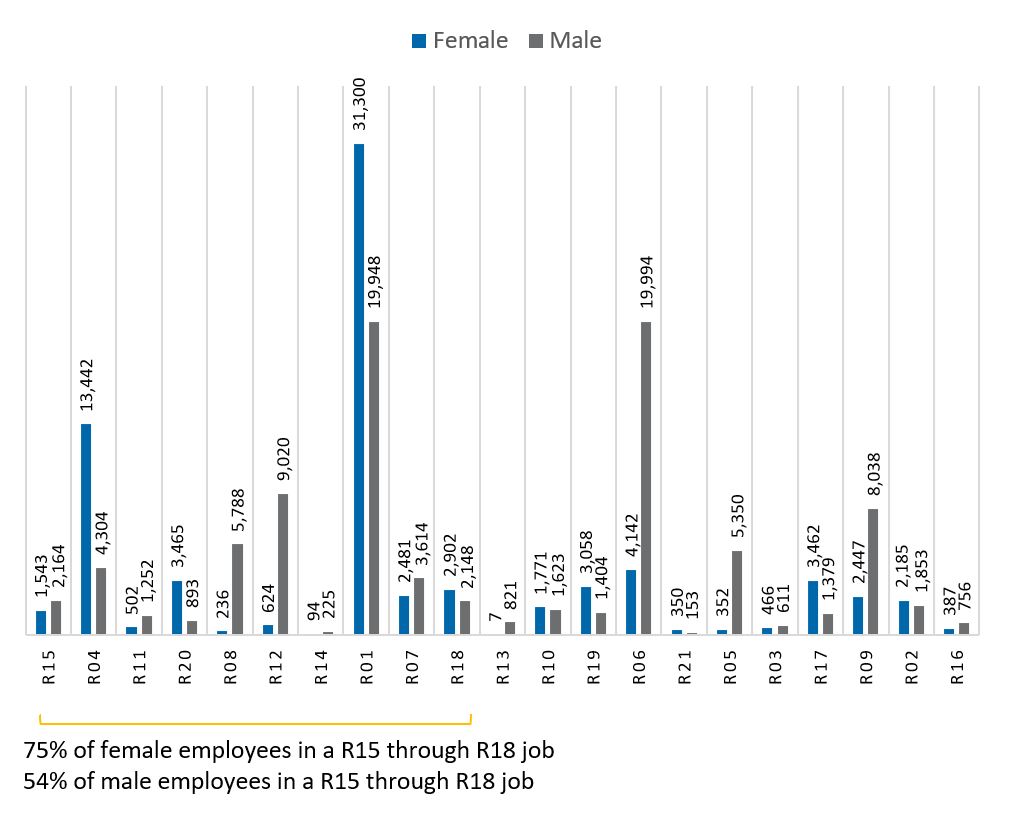
Chart 12 shows the representation of female and male workers within each bargaining unit. More women than men are employed in a bargaining unit on the lower end of the median pay spectrum (75 percent compared to 54 percent).
Chart 12: Female and Male Employees by Bargaining Unit in 2021
The Gender Pay Gap Differs by Ethnic Group
A gender pay gap can also be calculated by ethnic group. This is accomplished by comparing each group’s median pay to the median pay for all male employees. In the chart below the monthly median base pay and gender pay gap is displayed for women, by ethnic group, along with the statewide monthly median base pay for all women and all men. In 2021, the gender pay gap for Native American, Hispanic, Pacific Islander, and Black women was higher than the statewide female pay gap. The gender pay gap for White and Asian women was lower than the statewide female pay gap.[16]
Chart 13: Monthly Median Base Pay and Gender Pay Gap by Ethnicity in 2021
Bargaining Unit Membership Explains Median Pay
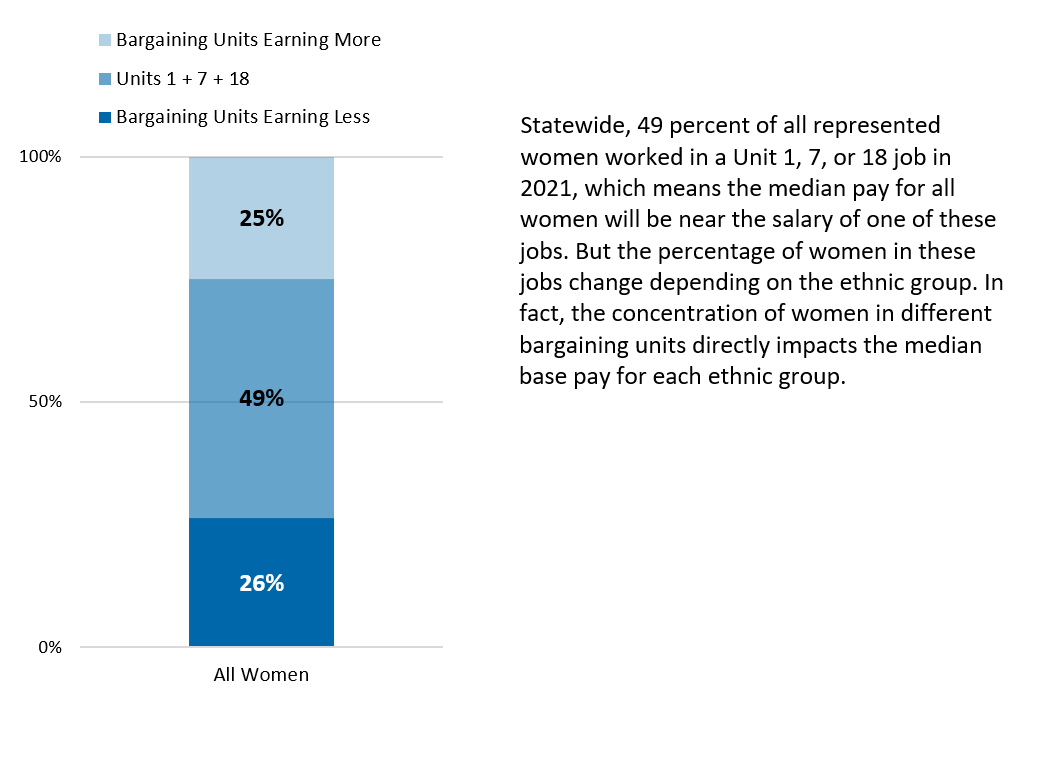
The charts below and on the following page summarize the percentage of female employees in one of three categories: bargaining units where the median base pay is higher than Unit 1, 7 or 18; Unit 1, 7 or 18 (near the female median base pay); and bargaining units where the median base pay is lower than Unit 1, 7 or 18.
Chart 14: Percentage of Represented Women in Bargaining Units
 By comparing the percentage of women in different bargaining units, it becomes clear how this is impacting the median pay for women in different ethnic groups.
Chart 15: Percentage of Women by Ethnicity in Bargaining Units[17]

To the left of the yellow dotted line in the chart above, 29 to 36 percent of Native American, Hispanic, Pacific Islander, or Black women are employed in a job represented by a bargaining unit earning less than Unit 1, 7, or 18.
By contrast, to the right of the yellow dotted line, a relatively small percentage (20 to 23 percent) of White and Asian women are in a bargaining unit earning less than Unit 1, 7 or 18. Just as important, a higher percentage of these women were employed in a job represented by a bargaining unit earning more.
Larger Share of Women in Bargaining Units With Higher Paying Jobs Has Helped Close the Gender Pay Gap in State Civil Service
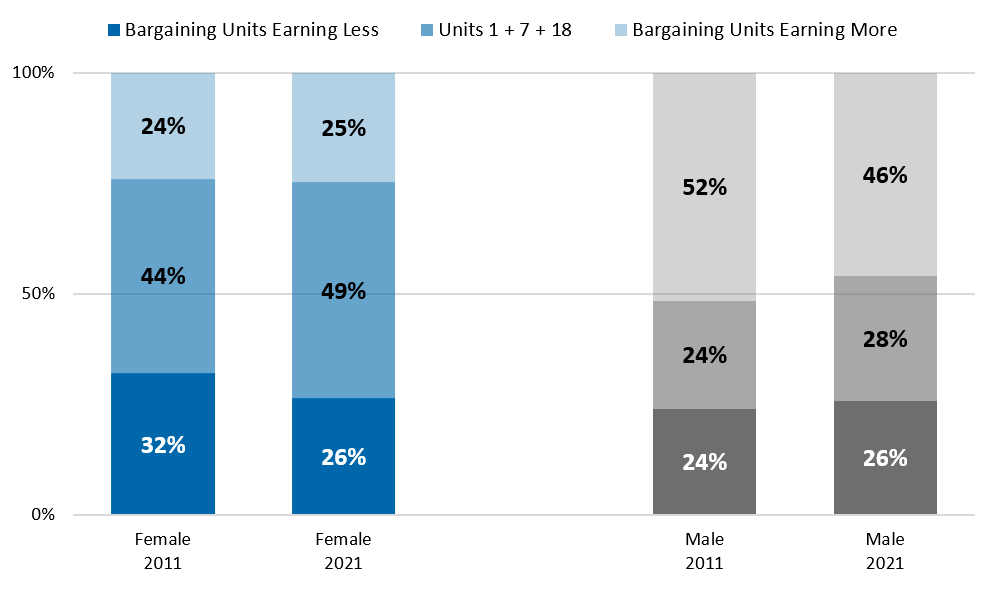
When comparing the concentration of women and men in different bargaining units in 2011 and 2021, it becomes clear that changes in gender representation in state jobs have helped close the gender pay gap since 2011. A larger share of women were employed in bargaining units with higher paying jobs in 2021. This has moved up the median pay for women over the past 10 years. Meanwhile, the share of men in bargaining units with higher paying jobs has declined since 2011. The combination of trends helped narrow the gender pay gap, moving the median pay for both genders closer to a Unit 1, 7 or 18 job.
Chart 16: Percentage of Females and Males by Bargaining Units in 2011 and 2021
Comparing Gender Representation for Civil Service and Exempt Executives in State Government in 2011 and 2021
Since 2011, the state has increased female representation in civil service executive positions. The chart below compares the percentage of women in 2011 and 2021, in the civil service Career Executive Assignment (CEA) classification. A “Career Executive Assignment” (CEA) is an appointment to a high administrative and policy influencing position within state civil service in which the incumbent’s primary responsibility is the managing of a major function or the rendering of management advice to top-level administrative authority.
Chart 17: Percentage of Women in Career Executive Assignments in 2011 and 2021[18] 
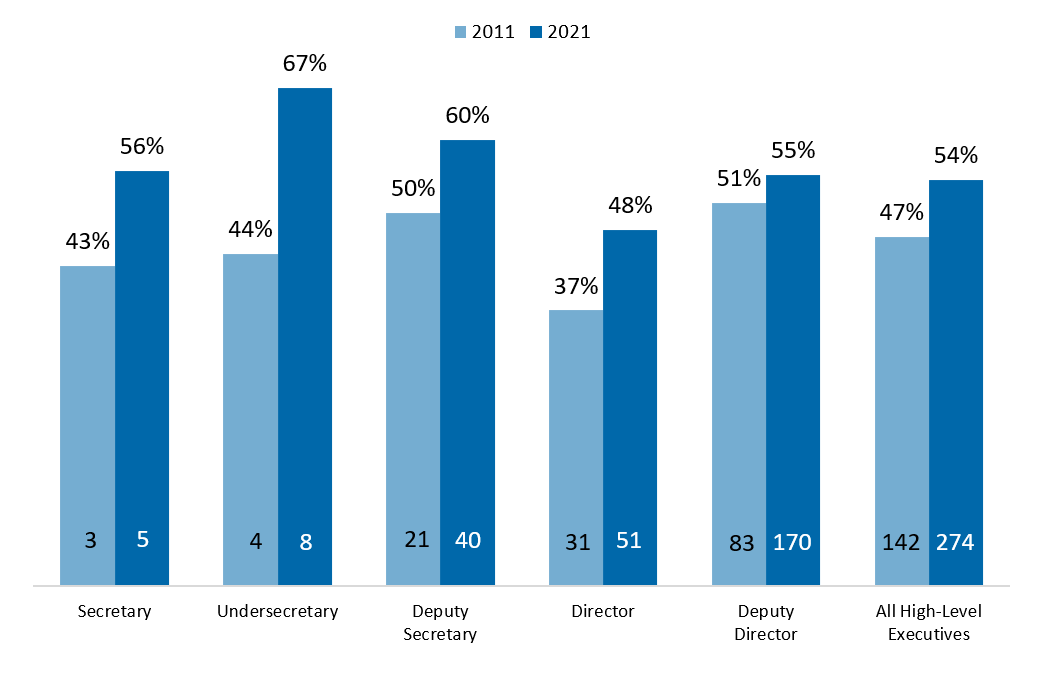
The state has made even more progress in increasing female representation in high-level executive positions (positions exempt from civil service hiring rules), of which most are appointed by the Governor. In 2011, women were 47 percent of high-level exempt executives, and as of 2021, they were 54 percent.
Chart 18: Percentage of Women in High-Level Exempt Positions in 2011 and 2021
 Comparing the Gender Pay Gap for Civil Service Executives
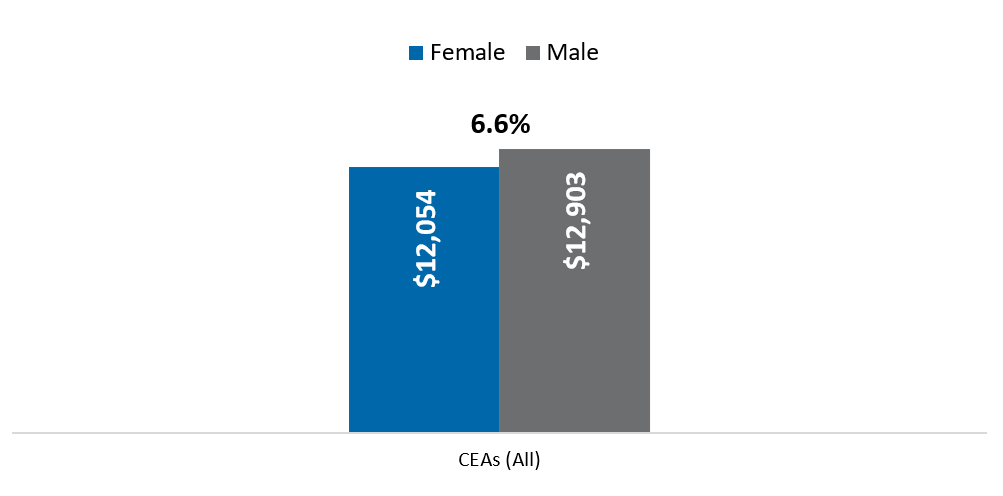
As of 2021, the median pay for male CEAs was higher than female CEAs. The CEA is a very broad classification, with no written classification specification as each job is considered to be unique.
For the entire CEA classification, there was a 6.6 percent female pay gap in 2021.
[19]
Chart 19: Monthly Median Pay and Gender Pay Gap for Civil Service Executives in 2021
Levels for Civil Service Executives (CEAs)
CEA positions are established at one of three levels, based on duties and responsibilities:
CEA Level A
Supervisory/ administrative experience in a line or staff activity, including the execution and/or evaluation of program policies.
CEA Level B
Broad administrative or program manager experience with substantial participation in the formulation, operation, and/or evaluation of program policies.
CEA Level C
Extensive managerial and program administrative experience which has included substantial responsibility for a combination of management functions such as program planning; policy formulation; organization coordination and control; and fiscal and personnel management.
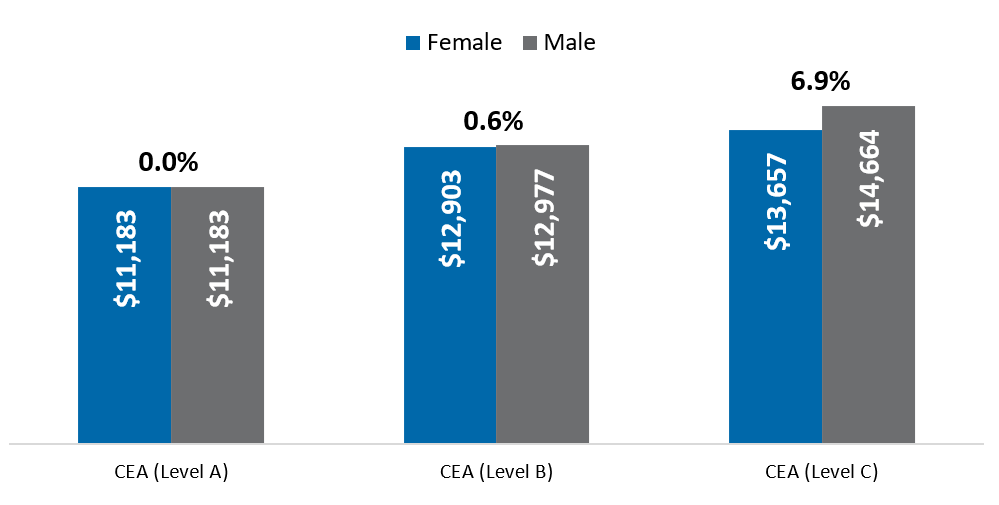
When comparing the median base pay within each level, the gender pay gap for women and men within Levels A and B was minimal. However, there was a higher gender pay gap for Level C in 2021.
Chart 20: Monthly Median Pay and Gender Pay Gap for CEAs by Level in 2021
 Women are Well Represented in Civil Service Executive Positions
Women were 54 percent of all CEAs, and 58 percent at Level A, 50 percent at Level B, and 54 percent at Level C. However, because women comprised the largest percentage of CEAs at Level A, that effectively moved down the overall median base pay for all female CEAs relative to all male CEAs.
Chart 21: Percentage of Civil Service Executives in Each Level by Gender in 2021

Comparing the Gender Pay Gap for Non-Civil Service Executive Positions
California’s State Constitution provides that members of boards and commissions, appointees of the Governor, and one appointee of each Governor’s appointee shall be exempt from civil service.
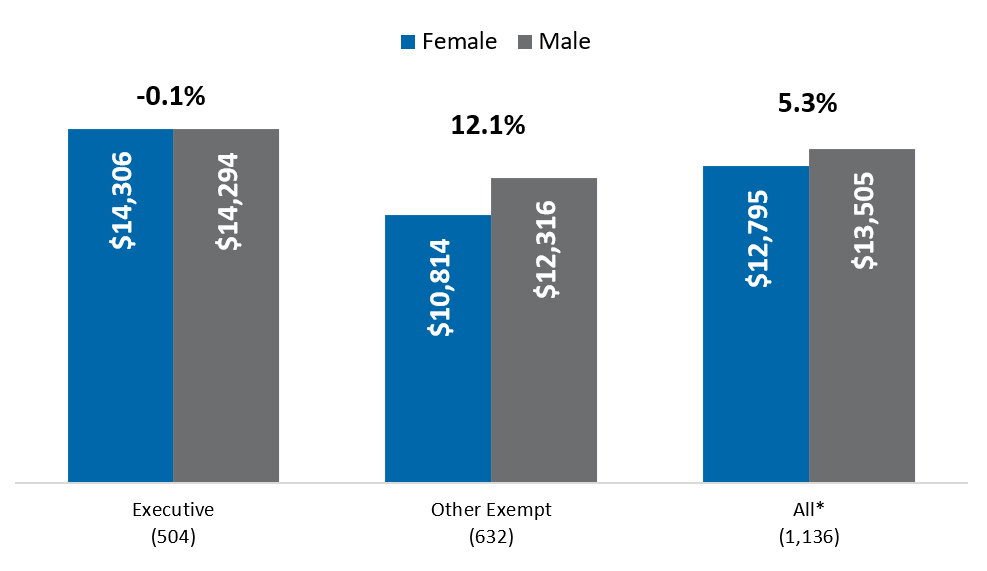
[20] These employees are referred to as “exempt employees” for the purpose of this report. In the chart below, exempt employees have been grouped into two categories: Executive-Level and Other Exempt.
[21] There was a 0.1 percent male pay gap among Executive-Level employees, a 12.1 percent female pay gap among Other Exempt employees, and an overall 5.3 percent female pay gap for All Exempt employees in 2021.
Chart 22: Monthly Median Pay and Gender Pay Gap for Exempt Employees in 2021
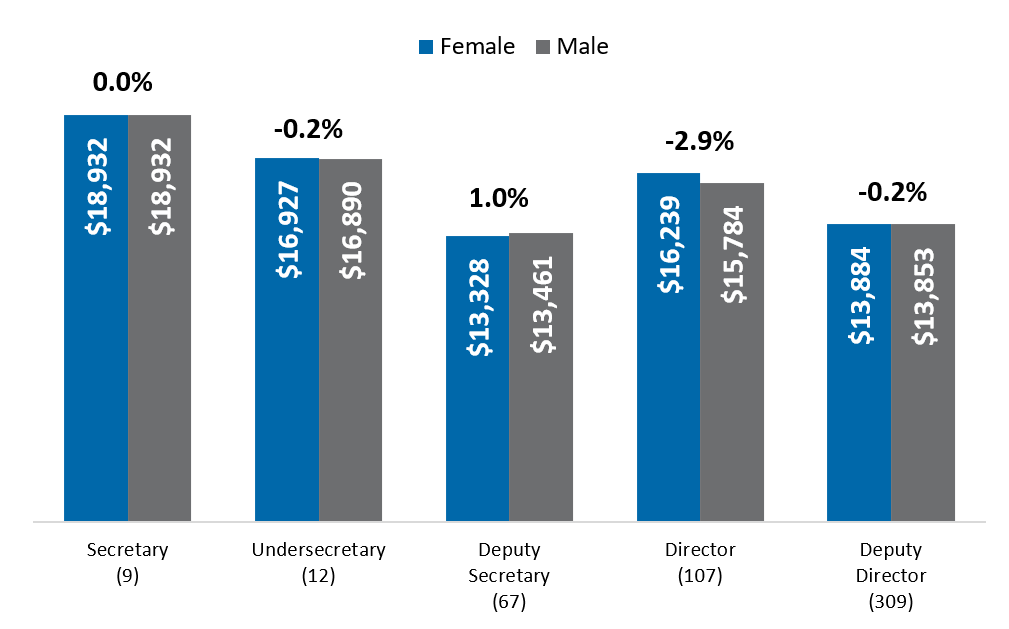
 When focusing on just the Executive-Level Exempt positions, the median base pay was very comparable for females and males across these categories.
Chart 23: Monthly Median Pay and Gender Pay Gap for Exempt Executives in 2021
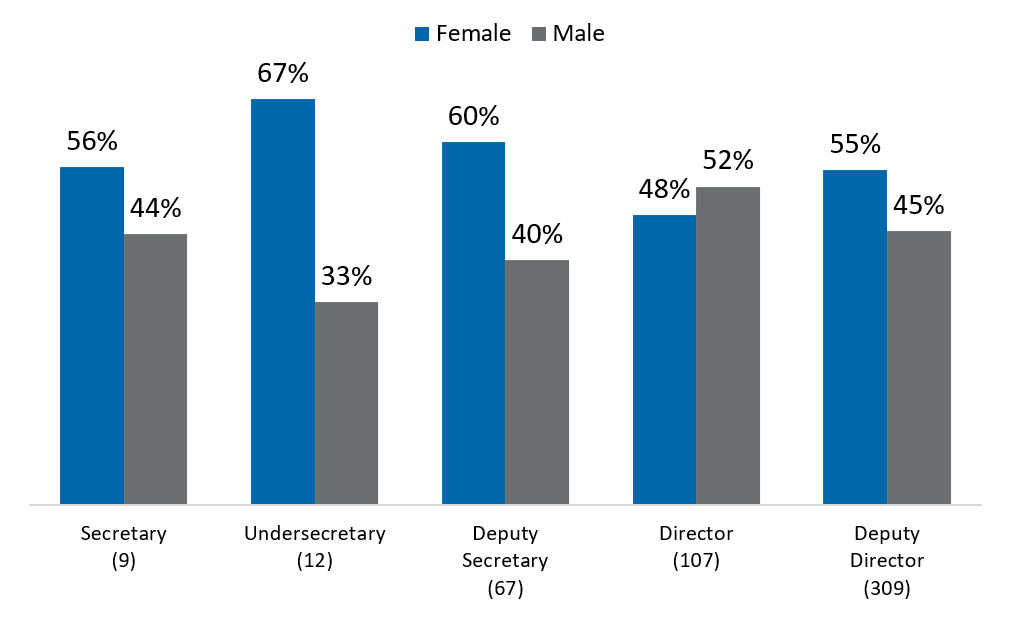
Women are Well Represented in Executive-Level Exempt Positions
Women were the majority in most of the executive level categories in 2021. Overall, within this Exempt Executive group, there were 504 employees: 54 percent female and 46 percent male.
Chart 24: Percentage of Exempt Executives at Each Level by Gender in 2021
New Initiatives to Address the Gender Pay Gap
Consistent with the California Equal Pay Pledge and California Leads as an Employer, CalHR received resources in the Budget Act of 2022, to implement the following initiatives to reduce unconscious bias and structural barriers in state employment and promote best practices that will close the pay gap.
Equal Employment Opportunity (EEO) Academy
An Equal Employment Opportunity (EEO) Academy will assist departments in developing EEO professionals and will ensure that each department’s EEO policies and procedures are implemented in compliance with current policies, statutes, and regulations. Courses will include, but not be limited to:
- EEO policy development, implementation, and enforcement.
- Monitoring recruitment, examination, and hiring practices to ensure fair and equitable processes.
- Data collection and analysis of demographic data for employees. Data analysis includes identifying underutilizations of protected groups, including women, in the state civil service relative to the relevant labor force, and working to improve representation of underrepresented groups.
- Discrimination, harassment, and retaliation prevention and the complaint and investigation process.
- Upward mobility, including administration and oversight of the program which was designed to assist women and people of color in low paying positions. Effective administration of the Upward Mobility Program provides employees in low paying positions with unique opportunities to learn and promote.
Anonymous Hiring Demonstration Pilot
Implicit bias during the recruitment, hiring, or selection process occurs when the brain makes quick judgments about a particular group(s) of people based on stereotypes, in a way that is either in favor or against the candidates. Demographic information on a candidate’s job application or resumé may produce implicit bias from the application reviewers, having an effect on the merit of the selection process. Anonymous hiring is a technique that redacts the personal information about the candidate from a hiring manager or recruiter that can lead to implicit bias negatively impacting the candidate. CalHR will design, develop, and test an anonymous hiring system.
Statewide Non-Traditional Apprenticeship Program
Apprenticeships can be an effective strategy for improving representation of underserved populations in the workforce. They can remove barriers women disproportionally face regarding both the cost and time associated with continued education, as well as provide key opportunities for on-the-job learning while continuing to earn current wages. Specific efforts will include:
- Exploration of where non-traditional apprenticeships can align with and supplement current Upward Mobility efforts to provide career paths for women in low-paying occupations.
- Identification of occupational sectors where women are over-represented and access to education and/or on-the-job experience present blocks to meeting the Minimum Qualifications in higher level classifications where there is a statewide need.
- Evaluation of where true career ladders may not yet exist to address a statewide or otherwise pressing succession management need and the potential development of pre-apprenticeships and/or non-traditional apprenticeships as part of a strategy to address gaps in needed knowledge, skills, and abilities.
- Outreach to women and other underserved populations in the state workforce to assess interest, identify potential blocks to application and/or participation, and explore strategies to address.
- Creation of ADA accessible marketing and other support resources to ensure women and other underserved populations are aware of all pre-apprenticeship and non-traditional apprenticeship programs that may benefit them, what resources are available to support their success, and access to all information needed to apply.
Upward Mobility
The Upward Mobility program is a career mobility program designed to give state employees in low-paying occupations an opportunity to advance to entry-level technical, professional, and administrative positions. Each state agency is required to have an active Upward Mobility program. Pursuant to AB 1604, CalHR will establish best practices and make changes to the program to increase diversity in hiring and other changes to the state’s upward mobility program with a goal of increasing participation in upward mobility programs.
Diversity, Equity, and Inclusion Strategic Plan
CalHR will develop a diversity, equity, and inclusion (DEI) strategic plan, best practices guidebook, and DEI training requirements. These DEI efforts will guide the state’s future efforts around attracting and retaining a diverse workforce.
Key Data Initiative: Enterprise Data Collection and Analysis
The Key Data Initiative (KDI) is a new program at CalHR which focuses on analyzing gender and racial pay equity across all classifications and departments. CalHR is developing new strategies and implementing new technology to report and analyze detailed state employee data including race/ethnicity, gender identity, and sexual orientation. KDI will allow CalHR to analyze comparable civil service and exempt classifications, pay history, demographic makeup, and department usage trends. KDI efforts include creating interactive public dashboards to bring transparency to the state’s hiring and compensation practices.
In addition to CalHR initiatives, there are policies, programs, and best practices to close the pay gap that are implemented at various state departments. These include implicit bias training, gender neutral language in job postings, increased targeted recruitment, diverse interview panels, and mentorship programs.